Background
As global regulations tighten and investor interest in sustainability grows, companies are facing unprecedented pressure to track and report their ESG (Environmental, Social, and Governance) performance. Most organizations struggle with fragmented data spread across different departments, making it nearly impossible for executives to have a clear, real-time view of their impact.
ESGFlex was conceived to bridge this gap, providing a centralized platform where complex data points are transformed into actionable insights. The challenge was to create a high-density executive interface that could convey complex regulatory status and performance metrics without overwhelming the user.
Understanding the problem
- Companies lack a single source of truth for ESG data, leading to inconsistent reporting.
- Executive decision-makers are often disconnected from real-time compliance risks.
- Regulatory deadlines are complex and vary across jurisdictions, increasing the risk of non-compliance.
- Measuring progress towards long-term sustainability goals is difficult with static spreadsheets.
Primary executive pain points in ESG management
Product vision and solution
Our visual strategy focused on professional reliability and clarity. We built a hierarchical dashboard that starts with a high-level Global ESG Score and drills down into critical operational metrics. The interface uses a 'Health Check' metaphor to communicate compliance status instantly, using color psychology (Green/Amber/Red) to drive immediate executive attention where it's needed most.
Environmental Focus
Automated tracking of Scope 1, 2, and 3 emissions providing a granular view of carbon footprint across the entire supply chain.
Governance & Compliance
Continuous monitoring of corporate governance controls and regulatory compliance to mitigate legal and reputational risks.
Defining the MVP
The MVP was centered around four core pillars of executive management:
Real-time ESG Scoreboard. A dynamic gauge showing overall performance with E, S, and G breakdowns.
Critical Metrics Tracking. Real-time monitoring of GHG emissions, energy intensity, and diversity ratios.
Compliance Health Check. A standardized checklist for internal controls and audit readiness.
Regulatory Deadlines. An automated calendar to ensure no reporting deadline is missed.
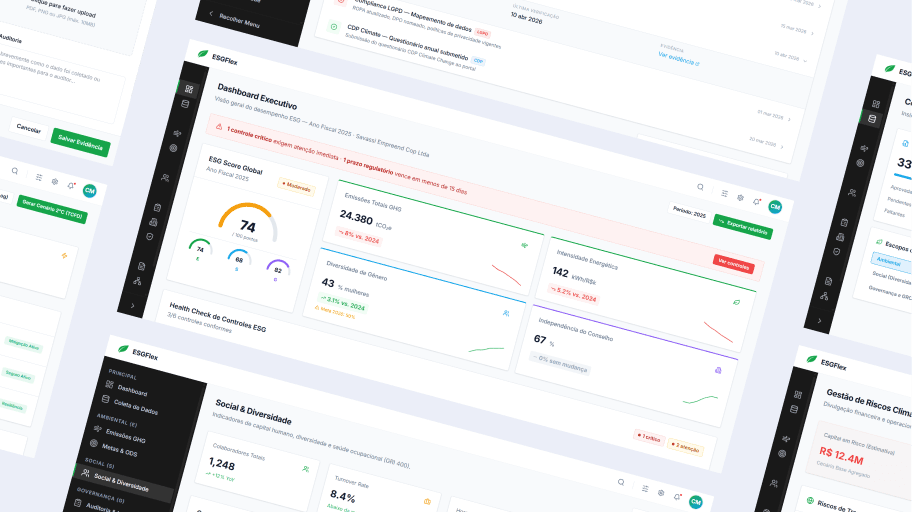
High-Fidelity Interface
The end result is a premium, data-driven experience that empowers C-level executives to lead their organization's sustainability journey with confidence.
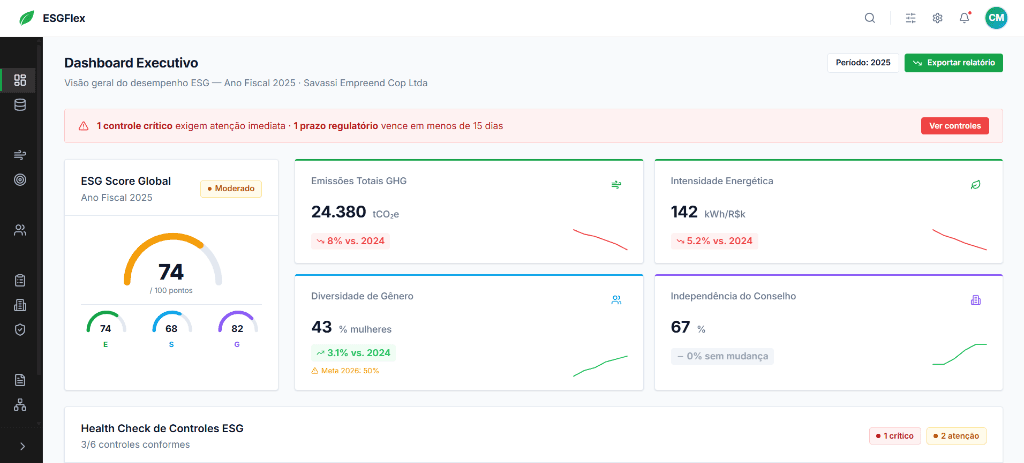
Executive Overview Dashboard
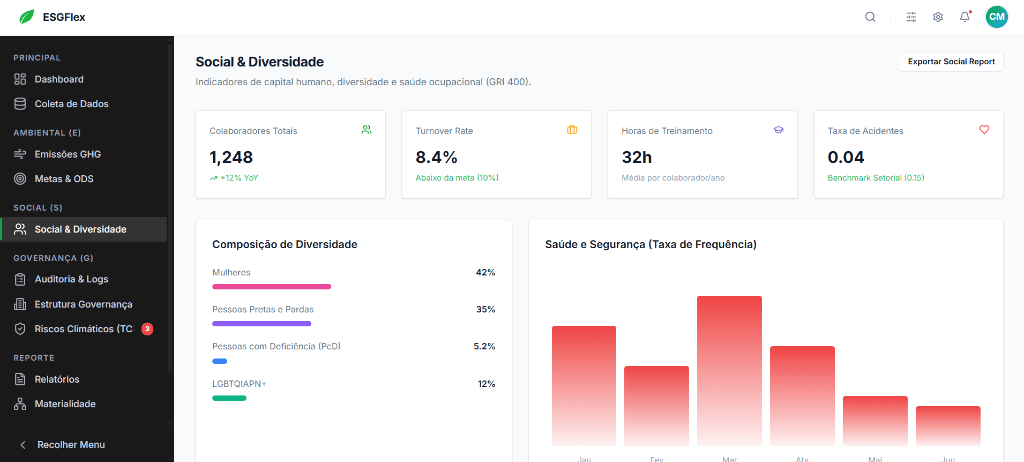
Social & Diversity Indicators
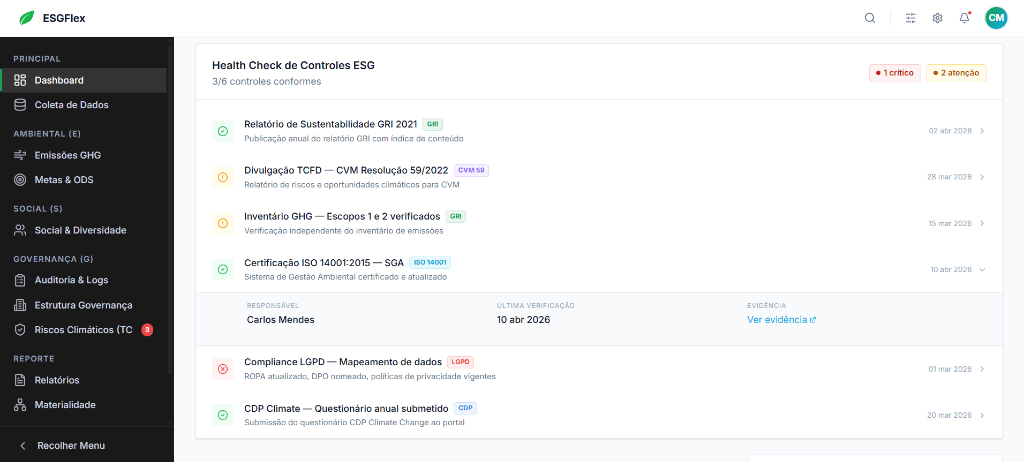
Compliance Health Check Checklist
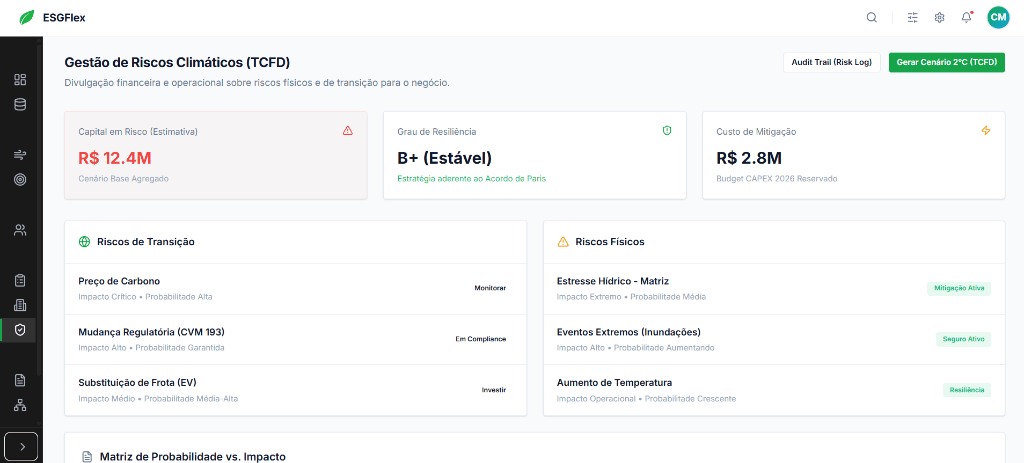
Climate Risk Analysis (TCFD)
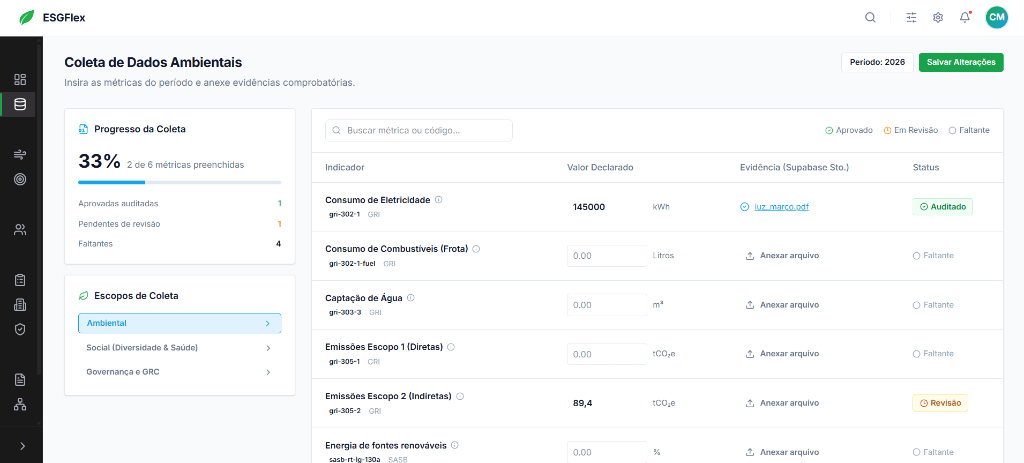
Environmental Data Collection
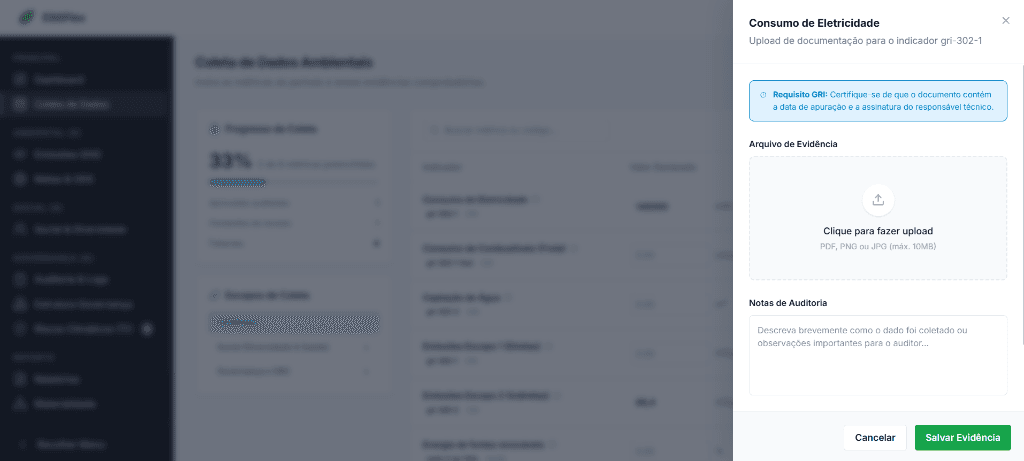
Evidence Management Drawer
Results and takeaways
Designing for ESG taught us that transparency is the ultimate feature:
Visualizing impact drives action. When stakeholders can see the real-time cost and benefit of their sustainability choices, buy-in increases across the board.
Complexity requires clarity. The more complex the data, the cleaner the design must be. Whitespace and clear typography were our best allies.
Compliance is mental peace. Automating the tracking of regulatory deadlines significantly reduces the 'cognitive noise' for governance teams.